Sunday, February 12, 2017

Blog Report Week 6


1. You will use the OPAMP in “open-loop” configuration in this part, where input signals will be applied directly to the pins 2 and 3.

a.) Apply 0V to the inverting input. Sweep the non-inverting input (Vin) from -5V to 5V with 1V steps. Take more steps around 0V (both positive and negative). Create a table for Vin and Vout. Plot the data (Vout vs Vin). Discuss your results. What would be the ideal plot?


Table 1: Non-Inverting
Op-amp
 Figure 1: Plot of Vin vs. Vout for an Non-Inverting Op-amp


  • Since it is an inverting op-amp, if the provided voltage going into Vin is positive, the output Vout would be negative because the voltage at terminal (-) is greater than voltage at terminal (+). Similarly Vout would be positive if the V(-) terminal was less than the voltage at the V(+) terminal. 
  • The Ideal results for out plot for this would be the output of [-5, 5]V instead of our           [-3.73, 4.5]V range.


b.) Apply 0V to the non-inverting input. Sweep the inverting input (Vin) from -5V to 5V with 1V steps. Take more steps around 0 V (both positive and negative). Create a table for Vin and Vout. Plot the data (Vout vs Vin). Discuss your results. What would be the ideal plot?


Table 2: Inverting
Op-Amp
Figure 2: Plot of Vin vs. Vout for an Inverting Op-amp


  • The Op-Amp's output will be equal to the V+ input if the Non-Inverting (+) input is greater than the Inverting Input (-).
  • An Ideal Model for an Non-Inverting Op-amp circuit would see an output of +5V for any positive input, an output of 0 for a 0V input, and -5V for any Negative input.

2. Create a non-inverting amplifier. (R2 = 2 kΩ, R1 = 1 kΩ). Sweep Vin from -5V to 5V with 1V steps. Create a table for Vin and Vout. Plot the measured and calculated data together.

Calculated Data

Table 1: Calculated data
for Non-Inverting op-amp
Figure 1: Plotted calculated data for Non-Inverting op-amp


Measured Data

Table 2: Measured data
for Non-Inverting op-amp
Figure 2: Plotted measured data for Non-inverting op-amp


  • The calculated gain for this Non-Inverting amplifier should have followed (1+R2/R1). We calculated that our constructed Non-Inverting amplifier would theoretically have a gain of about 3x the amount of voltage, surprisingly our measured Vout values exceeded our calculated ones for our (+1V and -1V) Vin inputs.


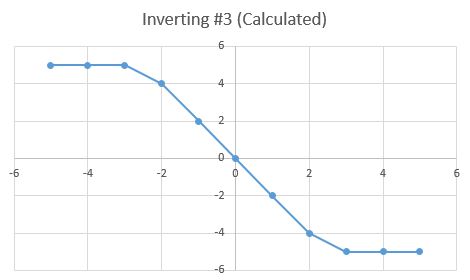
3. Create an inverting amplifier. (Rf = 2 kΩ, Rin = 1 kΩ). Sweep Vin from -5V to 5V with 1V steps. Create a table for Vin and Vout. Plot the measured and calculated data together.

Calculated Data

Table 3: Calculated data
for Inverting Op-amp
Figure 3: Plotted calculated data for Inverting Op-amp


Measured Data

Table 4: Measured data
for Inverting Op-amp
Figure 4: Plotted measured data for Inverting Op-amp


  • The calculated gain for this Inverting amplifier should have followed 1*(R2/R1).  We calculated that our constructed Inverting amplifier would theoretically have a gain of about -2x the amount of voltage, surprisingly our measured Vout values once again exceeded our calculated ones but this time only for our (-1V, -2V) Vin inputs.


4. Explain how an OPAMP works. How is the gain of the OPAMP in the open loop configuration too high but inverting/non-inverting amplifier configurations provide such a small gain?

  • The open loop configuration of the Op-amp does not actually act as an amplifier, but instead acts as a comparator. By definition a comparator: is a device for comparing a measurable property or thing with a reference or standard. If the positive(+) Non-Inverting input exceeds the negative(-) Inverting input, it's output is equal to whatever voltage is present on the V+ input. Conversely if the negative(-) Inverting input exceeds the positive(+) Non-Inverting input it's output is equal to whatever voltage is present on the V- input.
  • However, if you connect a pair of resistors to the op-amp then it can act as an amplifier. There are two types of amplifier configurations (Inverting and Non-Inverting) the Inverting Amplifier has a gain of -1*(R2/R1), as for the Non-Inverting amplifier its gain will be 1+(R2/R1). 


Temperature Sensor:

Put TMP36 temp sensor on breadboard. Connect the +VS to 5V and GND to ground.
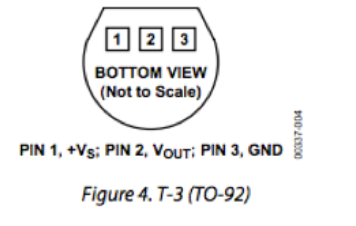
Using a voltage meter, measure the output voltage from the Vout. Now put your finger (or cover the sensor with your palm) on the TMP36 temperature sensor for a while, observing how the output voltage changes. Check Fig. 6 in the data sheet (EXPLAIN).

  • We attached fixed 5V to the TMP36 temperature sensor, and recorded the following data, displayed on (Table 1) below.
Table 1: Temperature sensor voltage output, tested at various heats.

  • Instead of just using the palms of our hands, we wanted to test various types of temperatures on the sensor, so we decided to make a data table for the different Vout outputs. There was no known discrete controls for the heat guns heat-output, plus temperatures can differ depending on the range its from the component. So we estimated that the temperature given off by the heat gun onto the board/sensor would be around 90℃ because the board was pretty warm but still touchable by the hand.


Relay:

1. Connect your DC power supply to pin 2 and ground pin 5. Set your power supply to 0V. Switch your multimeter to measure the resistance mode; use your multimeter to measure the resistance between pin 4 and pin 1. Do the same measurement between pin 3 and pin 1. Explain your findings (EXPLAIN).

  • With a power supply is set to 0 V there is no resistance across pins (1 & 4), because the contacts across the relay remain open unless a certain amount of required voltage is provided. However, there is a measurable resistance across pins (1 & 3), of 1.5Ω, this is because voltages applied within the range of 0-5V are allowed to pass through the contacts.   


2. Now sweep your DC power supply from 0V to 8V and back to 0V. What do you observe at the multi-meter (resistance measurements similar to #1)? Did you hear a clicking sound? How many times? What is the “threshold voltage values” that cause the “switching?” (EXPLAIN with a VIDEO).

Testing Voltage ranges on a relay.
  • *Note that our relay was broken for all the videos containing it, we did our best to explain what would happen.*
  • We didn't hear any clicking sounds, but we imagine it would a properly working 12V relay would have clicked twice.
  • The threshold values are: [Min: 4.2V, Max: 6.3V]


3. How does the relay work? Apply a separate DC voltage of 5V to pin 1. Check the voltage value of pin 3 and pin 4 (each with respect to ground) while switching the relay (EXPLAIN with a VIDEO).


Explains how a relay works, with respect to ground.
  • *Note that our relay was broken for all the videos containing it, we did our best to explain what would happen.*
  • The clicking sound is the switch being triggered by pin 1's voltage surpassing the required amount, causing the switch to allow voltage to flow from pin 2 to pin 4, the 2nd click is the switch switching back to pin 3 because the minimum voltage is not being supplied to pin 1.


LED + Relay:

1. Connect positive end of the LED diode to the pin 3 of the relay and negative end to a 100Ω resistor. Ground the other end of the resistor. Negative end of the diode will be the shorter wire.

2. Apply 3V to pin 1.

3. Turn LED on/off by switching the relay. Explain your results in the video. Draw the circuit schematic (VIDEO)

Photo: Schematic of the Relay has been triggered on and switched to supply 3V to the LED in the circuit.

Turning LED on/off using a relay. 

  • *Note that our relay was broken for all the videos containing it, we did our best to explain what would happen.*
  • The relay would eventually switch around 5-6 volts, however it did not, so we just showed how the relay would work on pin 3.


Operational Amplifier (data sheet under Bb/week 6)
1. Connect the power supplies to the op-amp (+10V and 0V). Show the operation of LM124 operational amplifier in DC mode with a non-inverting amplifier configuration. Choose any Op-Amp in the IC. Method: Use several R1 and R2 configurations and change your input voltage (voltages between 0 and 10V) and record your output voltage. (EXPLAIN with a TABLE)
Data Table: Non-Inverting Op-amp
with different variables.

  • In the data table above we decided to help best explain the gain, we would take into account the gain equation and show many of the different kinds. We used smaller R2 resistors than our R1 resistors. The data shows where the voltage threshold for Vout is.


2. Use your temperature sensor as your input. Do you think you can generate enough voltage to trigger the relay? (EXPLAIN)
  • Yes, we believe we can generate enough voltage from the amplifier to get the relay to switch pins. We calculated the gain using the non-inverting op-amp equation, to best reach the our relays trigger voltage of about 6.4V. To do this we had to figure out which R2 and R1 configuration would get us as close as possible to our desired value.


3. Design a system where LED light turns on when you heat up the temperature sensor. (CIRCUIT schematic and explanation in a VIDEO)

A drawing of our circuit

Video explaining what is going on in our circuit, based off of our drawing above.


4. BONUS! Show the operation of the entire circuit. (VIDEO)

Bonus video: Showing circuit operation

  • *Note that almost every component that we originally got for this lab was broken or didn't work the way it should have.*

Monday, February 6, 2017

Blog Report Week 5

1. Functional check: Oscilloscope manual page 5. Perform the functional check (photo).
The displayed output on the oscilloscope, after the
functionality check is completed.
  • Functionality Checks help ensure that the oscilloscope and its probes are working correctly. They should be done the first time it is used, as well as if the equipment has not been used in a while or is believed to be faulty. 


2. Perform manual probe compensation (Oscilloscope manual page 8) (Photo of overcompensation and proper compensation).

Photo 1: An "overcompensated" wave 
    Photo 2: A corrected wave in
    "proper compensation" 
  • To adjust the probe, use a key to turn the screw inside of its hole until it is properly compensated on the oscilloscope's display.  


3. What does probe attenuation (1x vs. 10x) do (Oscilloscope manual page 9)?
  • Some probes differ in their attenuation setting, you can tune these settings using the mechanical switch on the handle. Be sure that the oscilloscope's attenuation matches your probe's. By adjusting the attenuation, you're actually adjusting the impedance for a more accurate reading through you probes. Ensuring that your machines settings match those of your probe, you're allowing your machine to utilize its full bandwidth.


4. How do vertical and horizontal controls work? Why would you need it (Oscilloscope manual pages 34-35)?


  • Vertical position adjusts the cursors on the oscilloscopes screen.
  • Horizontal position of all channel and math waveform, its control varies with the time base setting.
  • You can position the data from both channels, as you can choose to have them displayed separately or overlapping.
  • The Scale controls allow the user to modify the display, so that the data can be enlarged or simplified for proper reading.


5. Generate a 1kHz, 0.5 Vpp around a DC 1V from the function generator (use the output connector). DO NOT USE oscilloscope probes for the function generator. There is a separate BNC cable for the function generator.

a.) Connect this to the oscilloscope and verify the input signal using the horizontal and vertical readings (photo).
The wave generated by the function generator values
displayed above.
  • We were able to generate a 0.5V Pk-Pk signal using the function generator. We adjusted the adjusted the voltage output to be about 1V, the "Auto-Set" measurements in the picture above prove this.

b.) Figure out how to measure the signal properties using menu buttons on the scope.
  • You can measure the signals properties by using the "Measure" button and adding the measurement tiles on the right side of the screen, in it you can access which channel and the type of measurement you want to monitor/record on the screen.


6. Connect function generator and oscilloscope probes switched (red to black, black to red). What happens? Why?

  • The scope does not "Auto-Set" the display correctly, it looks like there is noise mixed in with the signal, since it's signal is continuous and does not look sinusoidal. This is happening because you're connecting the oscilloscope probe to the ground, which grounds the signal before the machine can read it.


7. After calibrating the second probe, implement the voltage divider circuit below (UPDATE! V2 should be 0.5 Vac and 2 Vdc). Measure the following voltages using the Oscilloscope and comment on your results:


a.) Va and Vb at the same time (Photo)

The Va and Vb Voltages measured from the above circuit

  • The top (yellow) wave is Vb = CH1, while the bottom (blue) wave is Va = CH2. The values we used on the function generator were 1.01V for the AC (Our generator can't go below 1V) attempting to keep the [0.5 : 2]V as a ratio, we set the DC offset to 4V because of this. Also resistors R4 and R5 were not quite 1kΩ, they were actually about 1.183kΩ.
  • Notice how Va has about double the Pk-Pk Voltage compared to Vb. So when Va has the amplitude of 801V, Vb  will have an amplitude around 400V. Because the Amplitude is half that of the Pk - Pk value.

b.) Voltage across R4.
Photo 1: Attempted way of measuring Voltage across R4.
Photo 2: Using "Math" Function to find Voltage difference
across R4.

  • We attempted to directly measure the voltage across R4, but the didn't feel confident about the results because according to other blogs, you cant do this, so as a result we took the liberty to find an alternative way of measuring the voltage.
  • The "Math" measurement is set to [Math = CH1 - CH2] on the oscilloscope. This allows it to display the difference between the Pk-Pk values. So [R4 = Vb - Va] = [1.66V- 840mV=820mV] (O-scope says 860mV).


8. For the same circuit above, measure Va and Vb using the handheld DMM both in AC and DC mode. What are your findings? Explain.

Recorded (AC & DC) RMS Voltages - Using Handheld DMM:
  • In AC mode: Va = 2.81V, Vb = 561mV
  • In DC mode: Va = 280mV, Vb = 561mV

  • We found that the recorded DC voltage measurement for Vb doubles that of Va, what is odd is the difference between the AC voltages. From our understanding is voltage should be about the same across an entire circuit. The reason it is not is because if you attach the ground on the other side of a resistor you short the circuit, thus giving a different measurement than expected.


9. For the circuit below:


a.) Calculate R so given voltage values are satisfied. Explain your work (video)


Video explains how we calculated the resistance across R7

b.) Construct the circuit and measure the values with the DMM and oscilloscope (video). Hint: 1kΩ cannot be probed directly by the scope. But R6 and R7 are in series and it does not matter which one is connected to the function generator.

Video shows the measurement differences between DMM and oscilloscope.


10. Operational amplifier basics: Construct the following circuits using the pin diagram of the opamp. The half circle on top of the pin diagram corresponds to the notch on the integrated circuit (IC). Explanations of the pin numbers are below:


a.) Inverting amplifier: Rin = 1kΩ, Rf = 5kΩ (do not forget -10V and +10V). Apply 1 Vpp @ 1kHz. Observe input and output at the same time. What happens if you slowly increase the input voltage up to 5V? Explain your findings. (Video) 

Explaining inverting amplifier circuit, and changing its voltage
  • When we re-scaled the horizontal wavelength, we noticed that the crest for CH1 took place at the same time as CH2 trough. When the input voltage is low around 1V, the output signal is a sine wave. However, this changed when we adjusted the input voltage up to about 5V, you can see that the output signal changed to more of a square step-like function wave. Pins 4 and 7 control the voltage output range on the LM741 (-10V to 10V is about 20V.) 

b.) Non-inverting amplifier: R1 = 1kΩ, R2 = 5kΩ (do not forget -10V and +10V). Apply 1 Vpp @ 1kHz. Observe input and output at the same time. What happens if you slowly increase the input voltage up to 5V? Explain your findings. (Video)

Non-inverting amplifier circuit, and what happens when we change its amplitude
  • The signal on the non-inverting amplifier, just like its name says: is not inverted. When we increased the input voltage, the output signal was not affected. This could be because the output voltage reached its maximum while we increased the input voltage. Similar to the inverting amplifier, pins 4 and 7 control the voltage output range on the LM741 (-10V to 10V is about 20V.) 

Blog Report Week 4

1.
(Table and graph) Use the transistor by itself. The goal is to create the graph for IC (y-axis) versus VBE (x-axis). Connect base and collector. Use 10 KΩ potentiometer to generate the voltage. Use 5V but DO NOT EXCEED 1V for VBE. Make sure you have the required voltage value set before applying it to the base. Transistor might get really hot. Do not TOUCH THE TRANSISTOR! Make sure to get enough data points to graph. (Suggestion: measure for VBE = 0V, 0.5V, and 1V and fill the gaps if necessary by taking extra measurements). The circuit should look like the one below:
Data table 1: (Base/Emitter voltage)
and (Collector Current)

Graph 1: Data from table 1, modified to show the trend between Vbe and Ic.
Data #'s 7, 8 were removed to show exponential line.
  • For the circuit schematic above, our class decided to discard the 10k Ω potentiometer and instead just adjust the amount voltage manually using the power supply. The recorded data above shows an exponential relationship between the collector and base currents, as soon as the Vbe voltage hits around 0.65 V, you can see its current begins to increase exponentially on a curve. We stopped recording data around 0.8 V so that we didn't burn the transistor out.


2. (Table and graph) Create the graph for IC (y axis) versus VCE (x axis). Vary VCE from 0 V to 5 V. Do this measurement for 3 different VBE values: 0V, 0.7V, and 0.8V. The circuit should look like below:


Data Table 2: Shows recorded measurement combinations of
Vbe, and Vce set to various voltages to show the different IC outputs. 
Graph 2: Shows the visual correlations of the data table above,
notice how the differing voltages create both linear and exponential lines.


3. (Table) Apply the following bias voltages and fill out the table. How is IC and IB related? Does your data support your theory?
Table 3: IC and IB are related because it is the currents flowing through the transistor, equation IE = IC + IB also proves their relationship
  • IC and IB are related by beta (𝛃), 𝛃 = (IC / IB) our table above seems to be somewhat linear, thus we could say "yes, our data supports this theory." 


4. (Table) Explain photocell outputs with different light settings. Create a table for the light conditions and photocell resistance.
Table 4: Shows the amount of resistance is output due to
light conditions by the photocell

  • A photocell outputs different resistances based on the amount of light it recieves. The more light it receives, the less amount of resistance is supplied to the circuit. Our data above supports this.


5. (Table) Apply voltage (0 to 5 V with 1 V steps) to DC motor directly and measure the current using the DMM.

Table 5: Shows the relationship between the voltage and
amount of current flowing through the DC motor.


6. Apply 2 V to the DC motor and measure the current. Repeat this by increasing the load on the DC motor. Slightly pinching the shaft would do the trick.

Table 6: Shows the amount of pressure applied to the
shaft of the motor, and the current being drawn by the motor.


7. (Video) Create the circuit below (same circuit from week 1). Explain the operation in detail.


8. Explain R4’s role by changing its value to a smaller and bigger resistors and observing the voltage and the current at the collector of the transistor.

Table 7: Shows that the more voltage and resistance in the
transistor, the more current will be in its collector

  • The 47 Ω Resistor acts as a safety net for the transistor, almost like a fuse. It helps prevent any excess current that may come from the power supply. By raising the voltage it proves ohms law, that I = V/R, it starts increasing more


9. (Video) Create your own Rube Goldberg setup.


Sunday, January 29, 2017

Blog Report Week 3


1. Compare the calculated and measured equivalent resistance values between the nodes A and B for three circuit configurations given below. Choose your own resistors. (Table).

 
  • The following two tables contain data about the resistors for the three circuit configuration diagrams previously shown.

Table 1: Resistor Color Codes, and calculation work.

Table 2: Resistance calculation total from table above, compared to DMM measured resistance. 


2. Apply 5V on a 120 Ω resistor. Measure the current by putting the multimeter in series and parallel. Why are they different?
  • In series the DMM says that the resistor has 40mA of current flowing through it, however in parallel the circuit has 0.08mA flowing in it. The difference between the two is the amount of current that runs through the multimeter. When the multimeter is in series, all of the current must pass through the multimeter. When the multimeter is in parallel, the current is divided between the multimeter leads and the resistor. The multimeter will only measure the current that passes through it, and not the circuits total current.  


3. Apply 5 V to two resistors (47 Ω and 120 Ω) that are in series. Compare the measured and calculated values of voltage and current values on each resistor

Table 3: DMM measurement difference of voltages and currents between resistors set in series.
Since the resistors are in the same loop of the circuit, they will have the same current. However, since the the resistors values are different, to satisfy Ohm's law (V=IR), the voltage must be different across the resistors since they have the same current. 


4. Apply 5 V to two resistors (47 Ω and 120 Ω) that are in parallel. Compare the measured and calculated values of voltage and current values on each resistor.


Table 4: DMM measurement difference of voltages and currents between resistors set in parallel.
Since the ends of the resistors share the same node in the circuit, they must have the same voltage across them. Since the voltage is the same and the resistance values are different, to satisfy Ohm's law (V = I*R), the current of the two resistors must be different.


5. Compare the calculated and measured values of the following current and voltage for the circuit below: (breadboard photo) 
                                                                                                  
a.) Current on 2 kΩ resistor                                                                                                         
b.) Voltage across both 1.2 kΩ resistors.


Photo 1: Circuit layout shown on a breadboard

  • a.) The measured current across the 2kΩ resistor was 1.95mA. The calculated current for the 2kΩ resistor was 1.984mA. 
Figure 3: We converted the circuit into one resistor and used mesh analysis to find the current. The current of this loop will be equivalent to the current of the bottom loop in the full circuit.

  • b.) The measured voltage for the bottom 1.2 kΩ resistor is 0.812V and the measured voltage for the right side 1.2 kΩ resistor is 0.690V. The calculated voltage for the bottom 1.2 kΩ resistor is 0.833V and the calculated voltage for the right side 1.2 kΩ resistor is 0.7032V. 

Figure 4: We used mesh analysis to calculate the current for each loop. We then used Ohm's law (V = I*R) to calculate the voltage across each of the resistors. Our calculations are shown on the right.


6. What would be the equivalent resistance value of the circuit above (between the power supply nodes)?
  • The equivalent resistance between the two nodes of the circuit was 2.52kΩ. This was calculated by taking (2kΩ+(1.2kΩ//(100Ω+(1.2kΩ//1kΩ)))+100Ω)= 2519.7Ω.
Figure 5: Shows calculations reducing a circuit down to obtain its equivalent or total resistance.


7. Measure the equivalent resistance with and without the 5 V power supply. Are they different? Why?
  • The resistance values are the same with or without the power running through the circuit. The values are the same because the multimeter sends its own voltage through the circuit to test the resistance. It doesn't matter whether or not the circuit is hot. 
Figure 7: shows the resistance of the circuit with 5V
running through it.
Figure 6: shows the resistance of the circuit
without any power running through it.


8. Explain the operation of a potentiometer by measuring the resistance values between the terminals (there are 3 terminals, so there would be 3 combinations).
  • A potentiometer works by adjusting the resistance within itself to control the voltage output. The first pin is for voltage in and the opposite side pin is for ground. This is why the resistance across these two pins is always 10k. The middle pin is for output voltage which is controlled by the knob. The video attached shows this in action. 
Video 1: Explains the terminal pin-out for a potentiometer


9. What would be the minimum and maximum voltage that can be obtained at V1 by changing the knob position of the 5 KΩ pot? Explain.
  • This circuit contains only one resistor. This means that the voltage drop across the resistor must always be equivalent to the input voltage of, in this case, 5V. By adjusting the potentiometer's resistance, the only thing that will change is the current passing through the circuit.


10. How are V1 and V2 (voltages are defined with respect to ground) related and how do they change with the position of the knob of the pot? (video)

Video 2: Shows how the position of the knob can affect the voltages at different locations

  • The voltages V1 and V2 are related because V2 is always less than V1. V1 is equivalent to the input voltage of 5V at all times. V2 will always be equal to V1 minus the voltage across the 1k resistor. As the resistance 


11. For the circuit below, YOU SHOULD NOT turn down the potentiometer all the way down to reach 0 Ω. Why?
  • Turning the potentiometer all the way down to 0 Ω will short the circuit and allow too much current to flow through the circuit. 


12. For the circuit above, how are current values of 1 kΩ resistor and 5 KΩ pot related and how do they change with the position of the knob of the pot? (video).


Video 3: Demonstrates how a 330 Ω resistor and a 10 kΩ pot correspond with each others current values based on the pot's knob position.

  • When the potentiometer is set to its max resistance, the current through the 1k resistor will be at its max value because there will be much less resistance for the current to flow through the right loop. As the resistance of the potentiometer is moved closer to 0, the current in the left loop will increase because there will be a decreasing resistance for the current to flow through the left loop. As the left loop's current increases, the right loop's must decrease. This is how a current divider works. 


13. Explain what a voltage divider is and how it works based on your experiments.
  • A voltage divider works by using two resistors in series to reduce and/or control the larger input voltage. The voltage from the potentiometer can be controlled to values ranging from 0V to the input voltage. This is demonstrated in question 10.


14. Explain what a current divider is and how it works based on your experiments.
 
  • A current divider works by using two resistors in parallel to reduce and/or control the higher input current. By using a potentiometer as a variable resistor in between loop one and loop two, we are able to control the current within the loops to which ever current is needed. This is demonstrated in the circuit from question 11. 

Friday, January 20, 2017

Blog Report Week 2


1. What is the role of A/B switch? If you are on A, would B still give you a voltage?
  • The A/B switch allows you to read and set the values for the voltage and amperage, you can switch between A and B to see what each of the supplies are putting out on the meters. Suppose you are reading the meters for A, since both of the power supplies are independent from each other, B would still be able to give a voltage.


2. In each channel, there is a current specification (either 0.5 A or 4 A). What does that mean?
  • On the power supply we use there are two types of channels: 1 Fixed, and 2 continuous. On the fixed channel, the current specification is at a constant 4A. As for the continuous independent A/B channels, they can range up to 0.5A each.


3. Your power supply has two main operation modes for A and B channels; independent and tracking. How do those operation work?
  • This is a video discussing the three different modes of the DC power supply. The first being independent mode and the others being series and parallel versions of the tracking mode.

Video - Different PS Modes


4. Can you generate +30 V using a combination of the power supply outputs? How?
  • To generate the +30V output, you put the power supply in 

Figure 1: Shows that the tracking mode in series allows you to combine channels A and B to achieve voltages higher than 24 volts, up to 48 volts. 


5. Can you generate -30 V using a combination of the power supply outputs? How?

Figure 2: This photo shows that if you switch the probes' polarity from Figure 1, you can achieve negative voltages of up to 48V as well.


6. Can you generate +10 V and -10 V at the same time using a combination of the power supply outputs? How?
  • It is possible to achieve both negative 10V and positive 10V in the same power supply. This is achieved by connecting channel A and B in series at 10V, then grounding in between the two channels. Measuring from ground across channel B will give -10V and measuring from ground across channel A will give 10V.

Figure 3 (Left) and Figure 4 (Right): Figure 3 shows the voltage measurement at -10V because the probes are measuring from ground to the negative side of channel B. Figure 4 shows a measurement of 10V because the probes are measuring from ground to the positive terminal of channel A.


7.  Apply 5V to a 100 Ω resistor and measure the current by using the DMM. Compare the reading with the current meter reading on the power supply. At what angle of the current knob makes the LED light on? If you keep on decreasing the current limit, what happens to the voltage and current?
  • This video shows us supplying 5v to the circuit and reducing the current dial on the power supply until the light turns on. This light turns on to indicate that there is an insufficient amount of current to power the circuit to it's full power.

Video - Testing what happens when decreasing current at a rate 


8. Where is the fuse for the power supply? What is it for?
  • The Fuse for the power supply is located directly underneath the power-cable input-plug on the right side. Technically speaking the fuse is a safety feature, it helps protect the machine and circuits from damage, if too much current is supplied. In a situation where there is too much current, the fuse would blow and need a replacement to allow the power supply to operate again.


9. Where is the fuse for the DMM? What is it for?
  • The fuse's holder housing for the DMM is located on the back bottom-left panel, it is used to protect the circuits inside of the machine along with the user if too much current were supplied at once.


10. What is the difference between 2W and 4W resistor measurements?
  • The two wire and four wire methods are used to measure resistance more accurately. When measuring a resistor that is large, 1 kilohm or higher, the resistance of the two wire method does not make much of a difference. When measuring smaller resistors, 1 kilohm or smaller, the voltage drop across the probes of the multimeter can make a noticeable difference in your values. The four wire method allows the multimeter to push voltage through one wire and current through the other so there is no voltage drop across the probes.


11. How would you measure current that is around 10 A using DMM?
  • If we were asked to measure a current around 10A, the DMM would require the user to manually set the current range measurement to range up to 12A (AC or DC).