Tuesday, April 25, 2017

Blog Report Week 14-15 Liam

Explain your Rube Goldberg project by mentioning what your input data, what you did, and what your output data were. 
  • Inputs: Dominoes, 120VAC, 5V, 10V, 5V "Fixed",

  • What I did:  In my Rube Goldberg circuit, It begins with a set of dominoes being triggered by the previous groups circuit, a domino then falls onto a rocker light-switch which allows power to flow through a 120VAC power strip, to power a heat gun with a pre-set mechanical switch. This heat gun powers a temperature sensor with a 5V power source. 
    This hooked up to a LM324 Non-Inverting Operational Amplifier, the voltage gain [ Av = 1 + (2000Ω / 274Ω) ] = 8.3V. The op-amp requires a voltage supply equal or greater than the gain, so it’s (V+) is 10V.
    The output from the Op-Amp then flows into (pin 2) of a relay, by heating up the temperature sensor it will trigger the relay within a few seconds. (Pin 1) has a 5V "fixed" power source to ensure that enough voltage and current is supplied to components after the relay.

    The relay then triggers a 555 timer, attached to a 74192 Decimal Counter, and then a 7447 Display Driver, which finally displays a number that counts up from 0 to 9. The D output form the 74192 will be 1 and give a voltage of about (1 - 1.5)V which is not enough to power a motor, especially with an amperage of 0.04A. 
    So I used another Op-Amp and Relay with an additional separate power supply to power the motor when the voltage spikes at 9 seconds.
    At 9 seconds a motor will impulsively begin to spin, and it will pull a toy car across the table using a string, the toy car will have a 5V wire taped to it and will hopefully run into a metal wire ball that i have set up. This 5V connection will help power my partner Justin's circuit.

  • Outputs: Toy car that carry's 5V wire attached to it.


Drawings and sketches are expected to be drawn in CAD (MS Word, MS PowerPoint, or any drawing software). Both technical circuit drawing and mechanical part drawing are required. Photos of your RG setup are also required.
Draw the circuit schematic and list the parts you used with detailed explanations. 

A final sketch of Liam's Rube Goldberg Schematic.


Final Version of Liam's Rube Goldberg Block Diagram. 


  • Temperature sensor
  • 2 Op-Amps
  • 2 Relays
  • 1N4001 Diode
  • 555 Timer
  • 74192 Decimal Counter
  • 7447 Display Driver
  • 7 Segment Display
  • XOR Gate
  • LED
  • Motor


List 2 main challenges/road blocks during the project and provide enough details how you solved them. 
  • Getting my timer to work correctly was difficult because I didn't know that i had to use more current than what my circuit was being provided. I was able to solve this by troubleshooting using the multimeter, and modified an old phone charger to provide the extra power our circuit required. 
  • Another issue that i had was getting my 555 timer to work correctly, in an event where i was using a potentiometer to see how resistance affected the counting rate of the timer, the current would sometimes flow backwards and cause the relay to switch back to pin 3, rather than stay at 4. To solve this I used a 1N4001 diode to assure that the current only flowed in one direction.

Provide at least 1 detailed comments on 2 other RG groups by talking to them about their setup.


Monday, April 17, 2017

Blog Report Week 13 - Combined

6. Group task: Explain your group RG setup. 
  • Liam's circuit will begin with Dominoes falling onto a light switch and turning a heat gun on, to heat a temperature sensor. Next it will start a timer, counting until it reaches 9 seconds, and then spinning a motor with a string glued to a car (to act like a pulley system). The car will have a 5V wire attached to it and will begin Justin's Circuit.
  • Justin's circuit will begin with a 5V connection from Liam's circuit. This will spin a motor that pulls a stop block and releases a ball down a system of ramps. The ball will trigger a switch that sends power through an op amp, a relay, and into a timer. This will be connected to a binary counter. The least and most significant bits will be connected to an and gate which is then connected to a motor that will pull a paper off of the next group's circuit. 

7. Group task: Video of a test run of your group RG.


Blog Report Week 13 - Liam

1. Provide the updated computer drawing for your individual RG setup.
Block Diagram for Week 13 Rube Goldberg.
An updated circuit schematic for Week 13 Rube Goldberg.


2. Explain your setup.
  • In my Rube Goldberg circuit, It begins with a set of dominoes being triggered by the previous groups circuit, a domino then falls onto a rocker light-switch which allows power to flow through a 120VAC power strip, to power a heat gun with a pre-set mechanical switch. This heat gun powers a temperature sensor with a 5V power source. 
    • This hooked up to a LM324 Non-Inverting Operational Amplifier, the voltage gain         [ Av = 1 + (2000Ω / 274Ω) ] = 8.3V. The op-amp requires a voltage supply equal or greater than the gain, so it’s (V+) is 10V. 
    • The output from the Op-Amp then flows into (pin 2) of a relay, by heating up the temperature sensor it will trigger the relay within a few seconds. (Pin 1) has a 5V "fixed" power source to ensure that enough voltage and current is supplied to components after the relay. 
    • The relay then triggers a 555 timer, attached to a 74192 Decimal Counter, and then a 7447 Display Driver, which finally displays a number that counts up from 0 to 9. The D output form the 74192 will be 1 and give a voltage of about (1 - 1.5)V which is not enough to power a motor, especially with an amperage of 0.04A. So I used another Op-Amp and Relay with an additional separate power supply to power the motor when the voltage spikes at 9 seconds.
    • At 9 seconds a motor will impulsively begin to spin, and it will pull a toy car across the table using a string, the toy car will have a 5V wire taped to it and will hopefully run into a metal wire ball that i have set up. This 5V connection will help power my partner Justin's circuit. 

    3. Provide photos of the circuit and setup.


    Photo 1: My initial 120V AC power supply which
    has a switch that will be triggered by a domino,
    and then power a heat gun.

    Photo 2: A separate 12V 16A power supply.

    Photo 3: An angle to show where everything is at.
    Photo 4: Showing my motor from birds eye view.

    Photo 5: A side view of my circuits components.

    Photo 5: Showing my components
    and their wiring.

    Photo 6: The motor will pull this car with
     a 5V wire to trigger Justin's circuit.

    4. Provide at least 2 new videos of your setup in action, one being a failed attempt.
    Video 1: Updated Rube Goldberg Week 13 - Fail

    Video 2: Updated Rube Goldberg Week 13 - Success 

    5. What failures did you have? How did you overcome them?
    • One of the failures I had when making this circuit was trying to figure out how to get the 7-Segment-Display and all of its components to work properly with each other. I was able to overcome it by putting in long hours and having the tools and resources available to improvise solutions to get the counter working. For some odd reason my temperature sensor was grounded on pin 2 instead of pin 3, everything else was working somewhat correctly.
    • Another Failure of mine was getting the motor to trigger once the 7-Segment display reached the number 9 in the circuit. I was able to overcome this by using a separate power supply hooked up to a relay that was attached to an op-amp.

    Sunday, April 16, 2017

    Blog Report Week 13 - Justin

    1. Provide the updated computer drawing for your individual RG setup. 
    Figure 1: This is a basic schematic of my circuit. It excludes things such as power to components and some ground.

    2. Explain your setup. 

    Power will come to my setup in the form of a 5V pulse of electricity. This 5V will be directly connected to my motor. This motor will pull the stopping block in front of my ball, which will allow it to fall down the setup. The ball will land on a switch and activate it. This will allow 5V to run through the op-amp, increase to 7V, and trigger the relay. The relay will send voltage to an LED to start the next circuit while also powering a 555 timer that's 1st and 4th output will be hooked up to an AND gate. When this triggers, the LED will have power.

    3. Provide photos of the circuit and setup. 
    Figure 2: An overview of my circuit on the breadboard so far. 

    Figure 3: The top view of my catching component.

    Figure 4: The underside of my catching component that shows the switch.

    Figure 5: A picture of the ramp system that I have built for the ball to travel down.

    Figure 6: A close up picture of the motor on my mechanical component that will pull the stop block and allow the ball to roll down the ramp system. 


    4. Provide at least 2 new videos of your setup in action, one being a failed attempt. 


    Video 1: This is a failed attempt.

    Video 2: This is a partially successful attempt. 

    Video 3: This is a successful attempt

    5. What failures did you have? How did you overcome them? 

        One of the main failures that I faced was getting the mechanical component to successfully land inside of the catching mechanism that I had built. I tried to overcome this by taping the component onto the table to prevent the small movements between attempts. At first I had trouble getting the relay to trigger when I wanted it to, but I solved this by playing with the resistor values on my op amp until I could get it to work. I also have trouble will getting the ball to start rolling. It is not perfectly round so sometimes when the stop block is released, the ball remains there.

    Friday, April 7, 2017

    Blog Report Week 12 - Liam

    Your individual Rube Goldberg (RG) setup should satisfy the following:

    1. Use at least 5 of the following components:

    a.) Transistor
    b.) Op-Amp
    c.) Relay
    d.) Temperature sensor
     

    e.) Photosensor
    f.) Motor
    g.) Display
    h.) Strain gauge
    i.) Speaker
    j.) Microphone
    k.) Solar panel

    2. Use a new circuit: It can be a modification to one of our lab circuits.
    3. Let your system complete its task in no shorter than 10 seconds.
    4. Make sure you are compatible with your preceding and following RG stage.


    Your blog sheet week 12 tasks:

    1. Provide the computer drawing for your individual RG setup.

    Original Schematic: design layout of my RG circuit.

    Updated Schematic: design was updated because it was not complex enough, added dominoes.

    2. Explain your setup.
    • In my Rube Goldberg circuit, I start off with a 5V power source connected to a temperature sensor. 
    • The is hooked up to a LM324 Non-Inverting Operational Amplifier, the voltage gain       [ Av = 1 + (2000Ω / 274Ω) ] = 8.3V. The op-amp requires a voltage supply equal or greater than the gain, so it’s (V+) is 10V. 
    • The output from the Op-Amp then flows into (pin 2) of a relay, by heating up the temperature sensor it will trigger the relay within a few seconds. (Pin 1) has a 5V "fixed" power source to ensure that enough voltage and current is supplied to components after the relay. 
    • Once the relay triggers to (pin 4), the output will go to a 555 timer which will create a step-function frequency or better known as a clock rate, which will power a motor up to a motor (mechanical component). 
    • Since the motor’s power supply is impulsive, the attached arm must be set vertically so that gravity’s potential energy along can combine with the rotation speed to build enough momentum to overcome the initial resistance and stresses the motor faces when running. 
    • Once the motor starts to spin, it begins flicking/flipping a strain gauge (you can see the signal output generated by this on the oscilloscope shown in video 2), which leads into the next circuit/portion of the Rube Goldberg.


    3. Provide photos of the circuit and setup.

    Photo 1: Overview of entire Rube Goldberg setup.

    Photo 2: A closer look at the components wiring.

    Photo 3: A depth of view close-up on the circuits components.


    Photo 4: A look at the mechanical component (Motor)
    and Strain Gauge to next portion of circuit.


    4. Provide at least 2 videos of your setup in action (parts or whole), at least one being a failed attempt.


    Video 1: Rube Goldberg Circuit - Test Failure


    Video 2: Rube Goldberg Circuit - Successful Completion


    5. What failures did you have? How did you overcome them?
    • I struggled to get the relay to work properly, apparently using the 5V power source for both pins 2 and 1 will create an issue where the relay repeatedly turns on and off multiple times per second because the amount of voltage being drawn from past the relay creates an insufficient amount to continuously power the relay. I was able to solve this by using a separate 5V "fixed power source.

    • Hooking up the 555 timer to a motor works fine, except for when there is a load or opposing force on the motor, since its power supply is impulsive and not constant flow it created a problem where the weight of the arm was too much resistance for the motor to initially overcome. I was able to solve this by setting the arm vertically each time I ran my Rube Goldberg. 

    Wednesday, March 29, 2017

    Blog Report Week 11

    Part A: Strain Gauges:

    Strain gauges are used to measure the strain or stress levels on the materials. Alternatively, pressure on the strain gauge causes a generated voltage and it can be used as an energy harvester. You will be given either the flapping or tapping type gauge. When you test the circle buzzer type gauge, you will lay it flat on the table and tap on it. If it is the long rectangle one, you will flap the piece to generate voltage.


    1. Connect the oscilloscope probes to the strain gauge. Record the peak voltage values (positive and negative) by flipping/tapping the gauge with low and high pressure. Make sure to set the oscilloscope horizontal and vertical scales appropriately so you can read the values. DO NOT USE the measure tool of the oscilloscope. Adjust your oscilloscope so you can read the values from the screen. Fill out Table 1 and provide photos of the oscilloscope.


    Table 1: Low/High Voltage data collected from our Strain Gauge.
    Photo 1: Our oscilloscopes output for Strain Gauge


    2. Press the “Single” button below the Autoscale button on the oscilloscope. This mode will allow you to capture a single change at the output. Adjust your time and amplitude scales so you have the best resolution for your signal when you flip/tap your strain gauge. Provide photos of the oscilloscope graphs.


    Photo 2: Is of our oscilloscope in "single" mode
    showing a 'Hard Tap'.
    Photo 3: Is of our oscilloscope in "single" mode 
    showing a 'Light Tap'.


    Part B: Half-Wave Rectifiers

    1. Construct the following half-wave rectifier. Measure the input and the output using the oscilloscope and provide a snapshot of the outputs.

    Photo 4: Shows input/output of our half wave rectifier circuit 

    2. Calculate the effective voltage of the input & output, and compare the values with the measured ones by completing the following table.


    Table 2: Our measured and calculated RMS Input/Output Voltages  


    3. Explain how you calculated the rms values. Do calculated and measured values match?
    • For the full wave rms values, we divided the maximum input voltage by the square root of 2. 
    • For the half wave rms values, we divided the maximum output voltage by 2.


    4. Construct the following circuit and record the output voltage using both DMM and the oscilloscope.

    Table 3: Output voltages from our circuit with a 1µF capacitor


    5. Replace the 1 µF capacitor with 100 µF and repeat the previous step. What has changed?
    Table 4: Output voltages from our circuit with a 100µF capacitor

    • In the data tables above you can see when the 1µF was replaced with the 100µF capacitor the circuits peak-to-peak output voltage changes, decreasing a notable amount. However, the mean output voltage increases a little above 1 volt.


    Part C: Energy Harvesters

    1. Construct the half-wave rectifier circuit without the resistor but with the 1 µF capacitor. Instead of the function generator, use the strain gauge. Discharge the capacitor every time you start a new measurement. Flip/tap your strain gauge and observe the output voltage. Fill out the table below:

    Table 5: Data collected from our strain gauge using
    different "Tap Frequency's" and "Durations." 

    2. Briefly explain your results.
    • The data table shows a rising trend, as you increase the duration amount the more voltage will build up due to it's energy being stored in the capacitor. Also the higher the "Tap Frequency", the higher the amount of voltage will be stored into the capacitor. The output voltage for our 4 flip/second - 20 second duration seems to not follow this trend because we could not consistently record data, in a precise way when compared with the rest of the results.


    3. If we do not use the diode in the circuit (i.e. using only strain gauge to charge the capacitor), what would you observe at the output? Why?
    • By not using a diode we would observe an output with an RMS value of 0, because we the positive and negative voltage would reach the capacitor. By having a diode we're able to effectively charge the capacitor, using a diode because it acts as a half-wave rectifier (Filters out the negative parts of sinusoidal waves.) 


    4. Write MATLAB code to plot a figure of the data in 'Table 5' from Part C1.

    clear all;
    close all;
    x = [10, 20, 30];
    y1t = [1.32 1.51 2.19];
    y4t = [5.38 4.54 7.3];
    plot(x, y1t, 'r');
    hold on;
    plot (x, y4t, 'b');
    xlabel('Duration (s)', 'FontSize', 12);
    ylabel('Voltage Output (V)', 'FontSize', 12);
    legend('1 flip/second','4 flip/second');
    Figure 1: Plot of our data from 'Table 5', where we flipped
    our strain gauge using different variables.


    Sunday, March 19, 2017

    Blog Report Week 10

    PART A: MATLAB practice.
    1. Open MATLAB. Open the editor and copy paste the following code. Name your code as FirstCode.m 
    Save the resulting plot as a JPEG image and put it here:

    clear all;
    close all;
    x = [1 2 3 4 5];
    y = 2.^x;
    plot(x, y, 'LineWidth', 6);
    xlabel('Numbers', 'FontSize', 12);
    ylabel('Results', 'FontSize', 12);

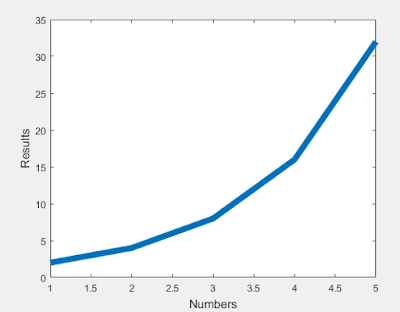
    Figure 1: Shows the exponentially generated line created in MATLAB 

    2. What does clear all do?
    • Clear all clears all of the previous commands that are left in the command window.


    3. What does close all do?
    • Closes all of the figures and windows that have been made previous to this command.


    4. In the command line, type x and press enter. This is a matrix. How many rows and columns are there in the matrix?
    • This matrix has 5 columns and 1 row.


    5. Why is there a semicolon at the end of the line of x and y?
    • This semicolon prevents the command from showing up in the command window, but still allows the command to go through. The semi-colon is there to end the variable's statement.


    6. Remove the dot on the y = 2.^x; line and execute the code again. What does the error message mean?
    • The period is there to allow multiplication with a matrix (or multiple values) 'x' is a matrix.


    7. How does the LineWidth affect the plot? Explain.
    • Line Width makes allows you to change the thickness of the graph.


    8. Type help plot on the command line and study the options for plot command. Provide how you would change the line for plot command to obtain the following figure (Hint: Like ‘LineWidth’, there is another property called ‘MarkerSize’)

    clear all;
    close all;
    x = [1 2 3 4 5];
    y = 2.^x;
    plot(x, y,'ro-', 'LineWidth', 6, 'markersize', 20)
    xlabel('Numbers', 'FontSize', 12)
    ylabel('Results', 'FontSize', 12)
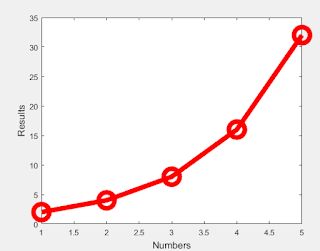
    Figure 2: Same as the first figure but with the added feature
    called 'markersize'.


    9. What happens if you change the line for x to x = [1; 2; 3; 4; 5]; ? Explain.
    • This adjusts the matrix by making it have 1 column and 5 rows. The semi columns cause you to "enter" within the matrix, moving your next entry down a row.


    10. Provide the code for the following figure. You need to figure out the function for y. Notice there are grids on the plot.

    clear all;
    close all;
    x = [1 2 3 4 5];
    y = x.^2;
    plot(x, y, 'sk:', 'LineWidth', 6, 'markersize', 20);
    xlabel('Numbers', 'FontSize', 12);
    ylabel('Results', 'FontSize', 12);
    grid on;
    set(gca, 'gridlinestyle', ':')
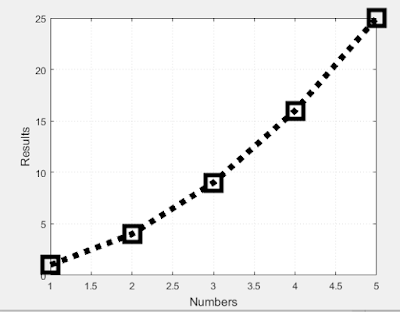
    Figure 3: Shows the replicated plot, with the 'y' function and grids.


    11. Degree vs. radian in MATLAB:

    (a.) Calculate sinus of 30 degrees using a calculator or internet.
    • sin(30) = 0.5

    (b.) Type sin(30) in the command line of the MATLAB. Why is this number different? (Hint: MATLAB treats angles as radians).
    --------------------------------------------------------------------------------------------------------------------------
    >>   sin(30)

    ans =

       -0.9880
    --------------------------------------------------------------------------------------------------------------------------
    • This number is different because 30 radians is not equivalent to 30 degrees and Matlab is doing the calculation with respect to radians while my calculator is doing the calculation with respect to degrees.

    (c.) How can you modify sin(30) so we get the correct number?
    • The command "sind( )" allows you to evaluate the problem with respect to degrees instead of radians.


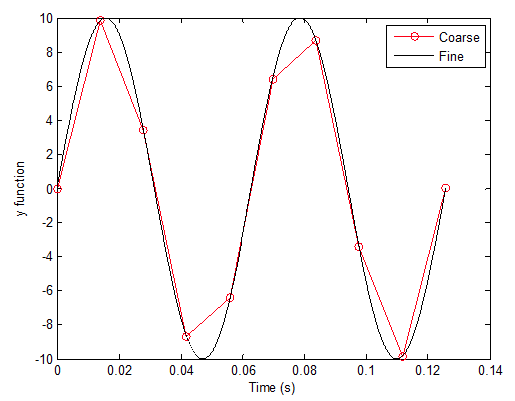
    12. Plot y = 10 sin (100 t) using MATLAB with two different resolutions on the same plot: 10 points per period and 1000 points per period. The plot needs to show only two periods. Commands you might need to use are linespace, plot, hold on, legend, xlabel, and ylabel. Provide your code and resulting figure. The output figure should look like the following:

    clear all;
    close all;
    clc;
    x = linspace(0, 0.1256636,10);
    y = 100*sin(100*x);
    plot(x, y, 'ro-');
    hold on;
    z = linspace(0, 0.1256636,2000);
    q = 100*sin(100*z);
    plot(z, q);
    xlabel('Time (s)');
    ylabel('y function');
    legend('Coarse', 'Fine');
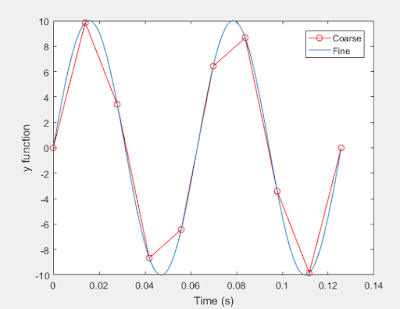
    Figure 4: Replicated figure, two resolutions of y = 10*sin(100*t) are plotted.


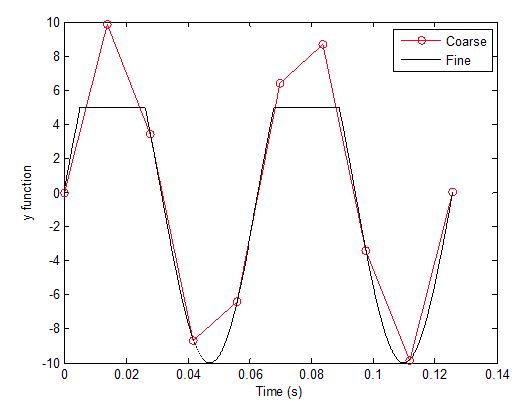
    13. Explain what is changed in the following plot comparing to the previous one.
    • The difference between the plot and the one in figure 4 is that in this one the "Fine" line is capped off with a maximum of 5.


    14. The command find was used to create this code. Study the use of find (help find) and try to replicate the plot above. Provide your code.

    clear all;
    close all;
    clc;
    x = linspace(0, 0.1256636, 10);
    x1 = linspace(0, 0.1256636, 2000);
    y = 10*sin(100*x);
    plot(x, y, 'ro-');
    hold on;
    y1 = 10*sin(100*x1);
    z = find(y1 > 5);
    y1(z) = 5;
    plot(x1, y1, 'k');
    xlabel('Time (s)');
    ylabel('y function');
    legend('Coarse', 'Fine');
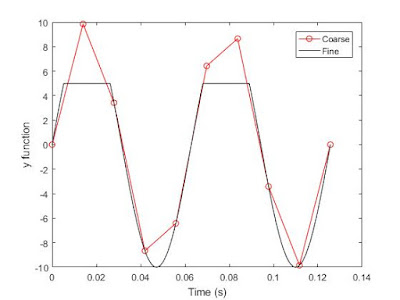
    Figure 5: is our attempt at replicating the plot from the 
    previous question


    PART B: Filters and MATLAB
    1. Build a low pass filter using a resistor and capacitor in which the cut off frequency is 1 kHz. Observe the output signal using the oscilloscope. Collect several data points particularly around the cut off frequency. Provide your data in a table.


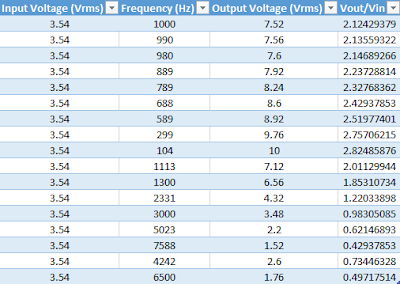
    Table 1: Data collected from a Low Pass circuit.


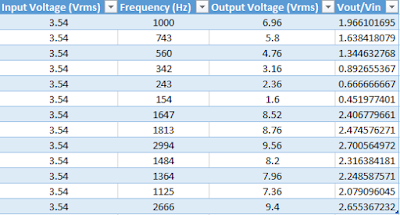
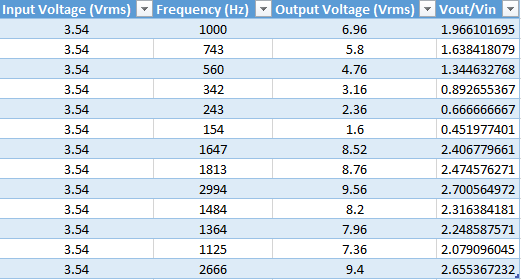
    Table 2: Data Collected from a High Pass circuit.


    2. Plot your data using MATLAB. Make sure to use proper labels for the plot and make your plot line and fonts readable. Provide your code and the plot.

    clear all;
    close all;
    x = [1000 990 980 889 789 688 589 299 104 1113 1300 2331 3000 5023 7588 4242 6500];
    y = [2.124 2.1356 2.1469 2.237 2.3277 2.4294 2.5198 2.7571 2.825 2.011 1.853 1.22 0.983 0.621 0.429 0.734 0.497];
    X = sort(x);
    Y = sort(y, 'descend');
    plot(X, Y, '-ro', 'MarkerSize', 5);
    xlabel('Frequency', 'FontSize', 12);
    ylabel('Vout / Vin RMS', 'FontSize', 12);
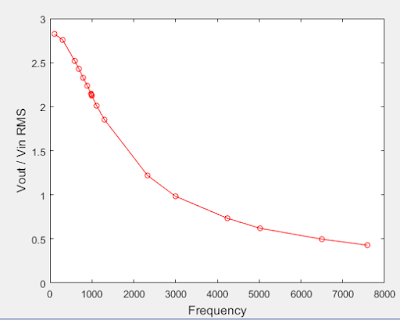
    Figure 6: Data from Low Pass circuit (Table 1) plotted in MATLAB.
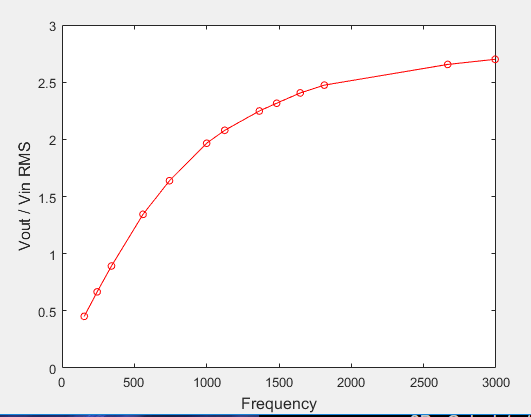

    clear all;
    close all;
    x = [1000 743 560 342 243 154 1647 1813 2994 1484 1364 1125 2666];
    y = [1.966 1.638 1.344 0.892 0.666 0.4519 2.406 2.474 2.700 2.316 2.248 2.079 2.655];
    X = sort(x);
    Y = sort(y);
    plot(X, Y, '-ro', 'MarkerSize', 5);
    xlabel('Frequency', 'FontSize', 12);
    ylabel('Vout / Vin RMS', 'FontSize', 12);
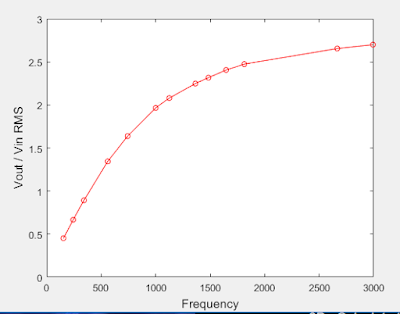
    Figure 7: Data from High Pass circuit (Table 2) plotted in MATLAB.


    3. Calculate the cut off frequency using MATLAB. The "find" command will be used. Provide your code.

    clear all;
    close all;
    x = [1000 990 980 889 789 688 589 299 104 1113 1300 2331 3000 5023 7588 4242 6500];
    y = [2.124 2.1356 2.1469 2.237 2.3277 2.4294 2.5198 2.7571 2.825 2.011 1.853 1.22 0.983 0.621 0.429 0.734 0.497];
    X = sort(x);
    Y = sort(y,'descend');
    plot(X, Y,'r', 'LineWidth', 6)
    xlabel('Frequency (kHz)', 'Fontsize', 12)
    ylabel('Amplitude of Vout (V)', 'FontSize', 12)
    hold on;
    k = find (Y > 5.96 * 0.65, 1, 'last');

    X(k)


    4. Put a horizontal dashed line on the previous plot that passes through the cutoff frequency.

    clear all;
    close all;
    x = [1000 990 980 889 789 688 589 299 104 1113 1300 2331 3000 5023 7588 4242 6500];
    y = [2.124 2.1356 2.1469 2.237 2.3277 2.4294 2.5198 2.7571 2.825 2.011 1.853 1.22 0.983 0.621 0.429 0.734 0.497];
    X = sort(x);
    Y = sort(y,'descend');
    plot(X, Y,'r', 'LineWidth', 6);
    xlabel('Frequency (kHz)', 'Fontsize', 12);
    ylabel('Amplitude of Vout (V)', 'FontSize', 12);
    hold on;
    x1 = (0:7588);
    y1 = 0.707*2.825;
    plot(x1, y1,'b+', 'LineWidth', 2);
    xlabel('Frequency (kHz)', 'Fontsize', 12);
    ylabel('Amplitude of Vout (V)', 'FontSize', 12);

    hold off;


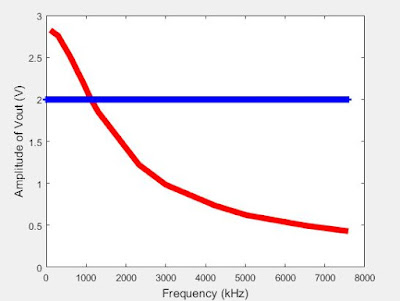
    Figure 8: Low Pass filter circuit's data plotted with cutoff frequency line

    5. Repeat 1-3 by modifying the circuit to a high pass filter.

    clear all;
    close all;
    x = [1000 743 560 342 243 154 1647 1813 2994 1484 1364 1125 2666];
    y = [1.966 1.638 1.344 0.892 0.6666 0.4519 2.406 2.4745 2.700 2.316 2.248 2.079 2.655 ];
    X = sort(x);
    Y = sort(y);
    plot(X, Y,'r', 'LineWidth', 6);
    xlabel('Frequency (kHz)', 'Fontsize', 12);
    ylabel('Amplitude of Vout (V)', 'FontSize', 12);
    hold on;
    x1 = (0:2994);
    y1 = 0.707*2.700;
    plot(x1, y1,'b+', 'LineWidth', 2);
    xlabel('Frequency (kHz)', 'Fontsize', 12);
    ylabel('Amplitude of Vout (V)', 'FontSize', 12);
    hold off;

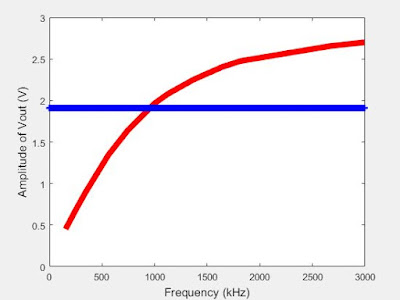
    Figure 9: High Pass filter circuit's data plotted with cutoff frequency