Strain gauges are used to measure the strain or stress levels on the materials. Alternatively, pressure on the strain gauge causes a generated voltage and it can be used as an energy harvester. You will be given either the flapping or tapping type gauge. When you test the circle buzzer type gauge, you will lay it flat on the table and tap on it. If it is the long rectangle one, you will flap the piece to generate voltage.
 |
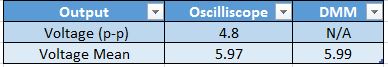
| Table 1: Low/High Voltage data collected from our Strain Gauge. |
 |
| Photo 1: Our oscilloscopes output for Strain Gauge |
2. Press the “Single” button below the Autoscale button on the oscilloscope. This mode will allow you to capture a single change at the output. Adjust your time and amplitude scales so you have the best resolution for your signal when you flip/tap your strain gauge. Provide photos of the oscilloscope graphs.
 |
| Photo 2: Is of our oscilloscope in "single" mode showing a 'Hard Tap'. |
 |
| Photo 3: Is of our oscilloscope in "single" mode showing a 'Light Tap'. |
Part B: Half-Wave Rectifiers
1. Construct the following half-wave rectifier. Measure the input and the output using the oscilloscope and provide a snapshot of the outputs.

 |
| Photo 4: Shows input/output of our half wave rectifier circuit |
2. Calculate the effective voltage of the input & output, and compare the values with the measured ones by completing the following table.
 |
| Table 2: Our measured and calculated RMS Input/Output Voltages |
- For the full wave rms values, we divided the maximum input voltage by the square root of 2.
- For the half wave rms values, we divided the maximum output voltage by 2.
4. Construct the following circuit and record the output voltage using both DMM and the oscilloscope.

 |
| Table 3: Output voltages from our circuit with a 1µF capacitor |
5. Replace the 1 µF capacitor with 100 µF and repeat the previous step. What has changed?
 |
| Table 4: Output voltages from our circuit with a 100µF capacitor |
- In the data tables above you can see when the 1µF was replaced with the 100µF capacitor the circuits peak-to-peak output voltage changes, decreasing a notable amount. However, the mean output voltage increases a little above 1 volt.
Part C: Energy Harvesters
1. Construct the half-wave rectifier circuit without the resistor but with the 1 µF capacitor. Instead of the function generator, use the strain gauge. Discharge the capacitor every time you start a new measurement. Flip/tap your strain gauge and observe the output voltage. Fill out the table below:
 |
| Table 5: Data collected from our strain gauge using different "Tap Frequency's" and "Durations." |
- The data table shows a rising trend, as you increase the duration amount the more voltage will build up due to it's energy being stored in the capacitor. Also the higher the "Tap Frequency", the higher the amount of voltage will be stored into the capacitor. The output voltage for our 4 flip/second - 20 second duration seems to not follow this trend because we could not consistently record data, in a precise way when compared with the rest of the results.
3. If we do not use the diode in the circuit (i.e. using only strain gauge to charge the capacitor), what would you observe at the output? Why?
- By not using a diode we would observe an output with an RMS value of 0, because we the positive and negative voltage would reach the capacitor. By having a diode we're able to effectively charge the capacitor, using a diode because it acts as a half-wave rectifier (Filters out the negative parts of sinusoidal waves.)
4. Write MATLAB code to plot a figure of the data in 'Table 5' from Part C1.
clear all;
close all;
x = [10, 20, 30];
y1t = [1.32 1.51 2.19];
y4t = [5.38 4.54 7.3];
plot(x, y1t, 'r');
hold on;
plot (x, y4t, 'b');
xlabel('Duration (s)', 'FontSize', 12);
ylabel('Voltage Output (V)', 'FontSize', 12);
legend('1 flip/second','4 flip/second');
close all;
x = [10, 20, 30];
y1t = [1.32 1.51 2.19];
y4t = [5.38 4.54 7.3];
plot(x, y1t, 'r');
hold on;
plot (x, y4t, 'b');
xlabel('Duration (s)', 'FontSize', 12);
ylabel('Voltage Output (V)', 'FontSize', 12);
legend('1 flip/second','4 flip/second');
 |
| Figure 1: Plot of our data from 'Table 5', where we flipped our strain gauge using different variables. |
No comments:
Post a Comment