
1. You will use the OPAMP in “open-loop” configuration in this part, where input signals will be applied directly to the pins 2 and 3.
 |
Table 1: Non-Inverting
Op-amp
|
 |
| Figure 1: Plot of Vin vs. Vout for an Non-Inverting Op-amp |
- Since it is an inverting op-amp, if the provided voltage going into Vin is positive, the output Vout would be negative because the voltage at terminal (-) is greater than voltage at terminal (+). Similarly Vout would be positive if the V(-) terminal was less than the voltage at the V(+) terminal.
- The Ideal results for out plot for this would be the output of [-5, 5]V instead of our [-3.73, 4.5]V range.
b.) Apply 0V to the non-inverting input. Sweep the inverting input (Vin) from -5V to 5V with 1V steps. Take more steps around 0 V (both positive and negative). Create a table for Vin and Vout. Plot the data (Vout vs Vin). Discuss your results. What would be the ideal plot?
 |
| Table 2: Inverting Op-Amp |
 |
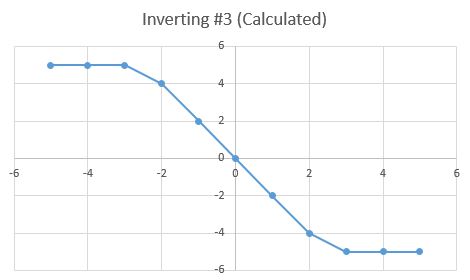
| Figure 2: Plot of Vin vs. Vout for an Inverting Op-amp |
- The Op-Amp's output will be equal to the V+ input if the Non-Inverting (+) input is greater than the Inverting Input (-).
- An Ideal Model for an Non-Inverting Op-amp circuit would see an output of +5V for any positive input, an output of 0 for a 0V input, and -5V for any Negative input.
Calculated Data
 |
Table 1: Calculated data
for Non-Inverting op-amp
|
 |
| Figure 1: Plotted calculated data for Non-Inverting op-amp |
Measured Data
 |
| Table 2: Measured data for Non-Inverting op-amp |
 |
| Figure 2: Plotted measured data for Non-inverting op-amp |
- The calculated gain for this Non-Inverting amplifier should have followed (1+R2/R1). We calculated that our constructed Non-Inverting amplifier would theoretically have a gain of about 3x the amount of voltage, surprisingly our measured Vout values exceeded our calculated ones for our (+1V and -1V) Vin inputs.
3. Create an inverting amplifier. (Rf = 2 kΩ, Rin = 1 kΩ). Sweep Vin from -5V to 5V with 1V steps. Create a table for Vin and Vout. Plot the measured and calculated data together.
Calculated Data
 |
Table 3: Calculated data
for Inverting Op-amp
|
 |
| Figure 3: Plotted calculated data for Inverting Op-amp |
Measured Data
 |
| Table 4: Measured data for Inverting Op-amp |
 |
| Figure 4: Plotted measured data for Inverting Op-amp |
- The calculated gain for this Inverting amplifier should have followed 1*(R2/R1). We calculated that our constructed Inverting amplifier would theoretically have a gain of about -2x the amount of voltage, surprisingly our measured Vout values once again exceeded our calculated ones but this time only for our (-1V, -2V) Vin inputs.
- The open loop configuration of the Op-amp does not actually act as an amplifier, but instead acts as a comparator. By definition a comparator: is a device for comparing a measurable property or thing with a reference or standard. If the positive(+) Non-Inverting input exceeds the negative(-) Inverting input, it's output is equal to whatever voltage is present on the V+ input. Conversely if the negative(-) Inverting input exceeds the positive(+) Non-Inverting input it's output is equal to whatever voltage is present on the V- input.
- However, if you connect a pair of resistors to the op-amp then it can act as an amplifier. There are two types of amplifier configurations (Inverting and Non-Inverting) the Inverting Amplifier has a gain of -1*(R2/R1), as for the Non-Inverting amplifier its gain will be 1+(R2/R1).
Temperature Sensor:
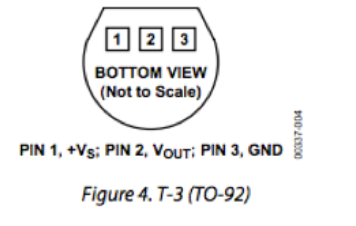
Put TMP36 temp sensor on breadboard. Connect the +VS to 5V and GND to ground.
- We attached fixed 5V to the TMP36 temperature sensor, and recorded the following data, displayed on (Table 1) below.
 |
| Table 1: Temperature sensor voltage output, tested at various heats. |
- Instead of just using the palms of our hands, we wanted to test various types of temperatures on the sensor, so we decided to make a data table for the different Vout outputs. There was no known discrete controls for the heat guns heat-output, plus temperatures can differ depending on the range its from the component. So we estimated that the temperature given off by the heat gun onto the board/sensor would be around 90℃ because the board was pretty warm but still touchable by the hand.
Relay:
1. Connect your DC power supply to pin 2 and ground pin 5. Set your power supply to 0V. Switch your multimeter to measure the resistance mode; use your multimeter to measure the resistance between pin 4 and pin 1. Do the same measurement between pin 3 and pin 1. Explain your findings (EXPLAIN).
2. Now sweep your DC power supply from 0V to 8V and back to 0V. What do you observe at the multi-meter (resistance measurements similar to #1)? Did you hear a clicking sound? How many times? What is the “threshold voltage values” that cause the “switching?” (EXPLAIN with a VIDEO).
3. How does the relay work? Apply a separate DC voltage of 5V to pin 1. Check the voltage value of pin 3 and pin 4 (each with respect to ground) while switching the relay (EXPLAIN with a VIDEO).
1. Connect positive end of the LED diode to the pin 3 of the relay and negative end to a 100Ω resistor. Ground the other end of the resistor. Negative end of the diode will be the shorter wire.
2. Apply 3V to pin 1.
3. Turn LED on/off by switching the relay. Explain your results in the video. Draw the circuit schematic (VIDEO)
2. Use your temperature sensor as your input. Do you think you can generate enough voltage to trigger the relay? (EXPLAIN)
3. Design a system where LED light turns on when you heat up the temperature sensor. (CIRCUIT schematic and explanation in a VIDEO)
4. BONUS! Show the operation of the entire circuit. (VIDEO)
- With a power supply is set to 0 V there is no resistance across pins (1 & 4), because the contacts across the relay remain open unless a certain amount of required voltage is provided. However, there is a measurable resistance across pins (1 & 3), of 1.5Ω, this is because voltages applied within the range of 0-5V are allowed to pass through the contacts.
2. Now sweep your DC power supply from 0V to 8V and back to 0V. What do you observe at the multi-meter (resistance measurements similar to #1)? Did you hear a clicking sound? How many times? What is the “threshold voltage values” that cause the “switching?” (EXPLAIN with a VIDEO).
Testing Voltage ranges on a relay.
- *Note that our relay was broken for all the videos containing it, we did our best to explain what would happen.*
- We didn't hear any clicking sounds, but we imagine it would a properly working 12V relay would have clicked twice.
- The threshold values are: [Min: 4.2V, Max: 6.3V]
3. How does the relay work? Apply a separate DC voltage of 5V to pin 1. Check the voltage value of pin 3 and pin 4 (each with respect to ground) while switching the relay (EXPLAIN with a VIDEO).
Explains how a relay works, with respect to ground.
- *Note that our relay was broken for all the videos containing it, we did our best to explain what would happen.*
- The clicking sound is the switch being triggered by pin 1's voltage surpassing the required amount, causing the switch to allow voltage to flow from pin 2 to pin 4, the 2nd click is the switch switching back to pin 3 because the minimum voltage is not being supplied to pin 1.
LED + Relay:
2. Apply 3V to pin 1.
3. Turn LED on/off by switching the relay. Explain your results in the video. Draw the circuit schematic (VIDEO)
 |
| Photo: Schematic of the Relay has been triggered on and switched to supply 3V to the LED in the circuit. |
Turning LED on/off using a relay.
- *Note that our relay was broken for all the videos containing it, we did our best to explain what would happen.*
- The relay would eventually switch around 5-6 volts, however it did not, so we just showed how the relay would work on pin 3.
Operational Amplifier (data sheet under Bb/week 6)
1. Connect the power supplies to the op-amp (+10V and 0V). Show the operation of LM124 operational amplifier in DC mode with a non-inverting amplifier configuration. Choose any Op-Amp in the IC. Method: Use several R1 and R2 configurations and change your input voltage (voltages between 0 and 10V) and record your output voltage. (EXPLAIN with a TABLE) |
| Data Table: Non-Inverting Op-amp with different variables. |
- In the data table above we decided to help best explain the gain, we would take into account the gain equation and show many of the different kinds. We used smaller R2 resistors than our R1 resistors. The data shows where the voltage threshold for Vout is.
2. Use your temperature sensor as your input. Do you think you can generate enough voltage to trigger the relay? (EXPLAIN)
- Yes, we believe we can generate enough voltage from the amplifier to get the relay to switch pins. We calculated the gain using the non-inverting op-amp equation, to best reach the our relays trigger voltage of about 6.4V. To do this we had to figure out which R2 and R1 configuration would get us as close as possible to our desired value.
3. Design a system where LED light turns on when you heat up the temperature sensor. (CIRCUIT schematic and explanation in a VIDEO)
 |
| A drawing of our circuit |
Video explaining what is going on in our circuit, based off of our drawing above.
4. BONUS! Show the operation of the entire circuit. (VIDEO)
Bonus video: Showing circuit operation
- *Note that almost every component that we originally got for this lab was broken or didn't work the way it should have.*
I believe your #1 a and b graphs and tables may be reversed. I think 1a was meant to be a non inverting open loop configuration. So a +Vin should result in a +Vout. At least that is the result we got from our experiments.
ReplyDeleteThanks for the notice, i made a change and quickly fixed it this morning.
DeleteThank you for pointing this out. I agree with your statement.
DeleteI agree with Daniel Bruce. It seems like your two graphs are flipped. Also it might be best to refrain from highlighting things in yellow or red, or any color. It makes it difficult to read.
ReplyDeleteMade changes this morning, thanks for catch
DeleteI believe this is just to make it easier to find what we need to work on still. We usually switch it before we turn it in for good.
DeleteThe graphs are still flipped for number 1, a and b. like Alec said the highlighting can make the blog kinda hard to read sometimes. The dark background color kinda interferes with any color you have with the tables or text.
ReplyDeleteMade changes this morning, also the text is usually highlighted if we haven't answered a question yet, its to help us keep track while drafting our posts.
DeleteI agree with what Liam said. Thanks for the heads up, though.
DeleteMy group have similar calculations to you, but you flipped a with b in Q#1.
ReplyDeleteIn Q3 you forgot to add calculated calculation to the plot.
Good job
Made changes this morning to #1, and added in the calculated data aswell. Thanks!
DeleteThank you for the heads up. Liam took care of it for us.
DeleteFor question 2, there was an evident horizontal shift away from the expected values. Is there a reason (for example, an equipment error), which could have caused this to happen? Also, my group noticed a wider variety of values between -2 and 2 for this same plot; any thoughts on why that might be?
ReplyDeleteI'm pretty sure this post was made before we added in our calculated values for #2 and #3. Our values seem to somewhat match our expected, 1a and 1b were originally flipped when you posted this. We probably needed more recorded data inorder to match more closely to our calculated, we also graphed our zeros which added to the data being displayed slightly different from other blogs posted for week 6.
DeleteThank you for pointing this out. I agree with Liam that we should have done more data points.
DeleteOur values for question 1 part a are negative outputs for negative inputs and positive outputs for negative inputs. For part b are values are also flipped. Make sure you also add calculated values for questions 2 and 3.
ReplyDeleteChanged that this morning, we didn't know it was flipped until we read the comments.
DeleteThank you for noticing. We were a little confused on this when we did the experiment, but we got it figured out.
Deleteyour videos are well explained. In Q4 I like how you explained the relationship of the gain in inverting/non inverting amplifier. Q2 and Q3 are missing the calculated output voltage. other than this your blog is good.
ReplyDeleteChanged that earlier this morning, appreciate the positive feedback!
DeleteThank you for the feedback and thank you for pointing out the missing information.
DeleteBlog very well structured, however more data points could have been used for 1a and 1b around -1 to 1 to have a more accurate graph.
ReplyDeleteVery true, also the same could be said that we shouldn't have graphed our zeros without having more recorded data. We'll try to take this into account in future posts
DeleteI think this a good piece of advice. Thank you for that.
DeleteWell done with the drawn portions of the blog. You may want to add calculated values to your earlier problems. Also, how did you get your graph to be so curved on problem 3, ours looks significantly different, and more linear between.
ReplyDeleteIt's not required and might confuse the readers, based on what was being asked. I did try to explain what was going on with the different equations for the Op-amps later on though.
DeleteI am not sure what cause this. It may be our choice of graphing the zeros.
DeleteI really like that you guys took the time out to post your tables right next to your graphs, it does help with the understanding. Its nice that you guys did the temperature sensor part to see how its done because most of us didn't get a sensor. Our calculations look on par with each other so good job!
ReplyDeleteYeah, its unfortunate I didn't know why it was taking voltage away from our relay for the final video. But we initially didn't get one until Sunday night (I brought one in from a kit i had at home).
DeleteThank you for your positivity. I'm glad it was easy to understand.
DeleteI think your graphs for your open loop amps are a little off. The gain is so high on an open loop op amp that it looks like there is a vertical line at 0. I know it is hard to measure with the equipment we have, but it may be worth mentioning.
ReplyDeleteI think its because we plotted zero in with our plot, that might have messed up the way the data is displayed slightly
DeleteOur power supply has trouble getting close to zero, so this may have been part of the problem.
DeleteYour videos are very well explained. I like how you guys used the space available and organized the data tables next to the graphs to make it easier to visualize. The data was pretty similar to what we got also.
ReplyDeleteThank you, it's pretty difficult to do this using bloggers editor
DeleteThank you for the positive feedback.
Deleteour data was quite similar to yours except you reached Vout max quicker than we did for #1. for #2 our values were very similar with how our Vout were what you'd expect them to be considering the gain. Also we had the same idea for #4.
ReplyDeleteGlad to see you had some similarities with our blog. I'm not sure what caused the difference.
DeleteVery nice blog and organized. Our data are very close to yours in the tables. The only difference is that we measured more values between 1 and -1 to see if we are going to get anything before we reach the max. For question 2 and 3 I was confused when I first looked at it, but when I realized the way you've done it was more organized and clear because we did it the calculated and the measured data in one table. Good gob in reaching the BONUS question.
ReplyDeleteWell done.
Our power supply has trouble between 1 and -1 so it makes it hard to include multiple values between there.
DeleteGood job!
ReplyDeleteGood interaction with others. Thank you.