- The measure speakers resistance was about 8.8Ω, the expected resistance for this speaker listed online was about 8Ω.
2. Build the following circuit using a function generator setting the amplitude to 5V (0V offset). What happens when you change the frequency? (video)

Video 1: Demonstrating the circuit from the diagram above
 |
| Table 1: Explains our observations at different frequency's from the circuit above |
- When you change the frequency the audio produced by the speaker changes, the higher it goes the high pitched the sound becomes until it becomes undetectable around 20 kHz.
 |
| Table 2: Shows our observations, along with the oscilloscope's output at different resistances. |
4. Build the following circuit. Add a resistor in series to the speaker to have an equivalent resistance of 100 Ω. Note that this circuit is a high pass filter. Set the amplitude of the input signal to 8 V. Change the frequency from low to high to observe the speaker sound. You should
not hear anything at the beginning and start hearing the sound after a certain frequency. Use 22 nF for the capacitor.
 (a.) Explain the operation. (video)
Video 2: High pass filter in operation, note that even though
it was called a low pass in the video, the circuit setup is high.
(b.) Fill out the following table by adding enough (10-15 data points) frequency measurements. Vout is measured with the DMM, thus it will be rms value.
it was called a low pass in the video, the circuit setup is high.
(b.) Fill out the following table by adding enough (10-15 data points) frequency measurements. Vout is measured with the DMM, thus it will be rms value.
 |
| Table 3: Recorded values using the DMM, function generator, and oscilloscope to determine Vout/Vin |
(c.) Draw Vout/Vin with respect to frequency using Excel.
(d.) What is the cut off frequency by looking at the table (b.) and plot of it in (c.)?
(e.) Draw Vout/Vin with respect to frequency using MATLAB, use the following code:
Frequency = [ ]; % data points will be in the brackets
(f.) Calculate the cut off frequency theoretically and compare with one that was found in c.
(g.) Explain how the circuit works as a high pass filter.
(5.) Design the circuit in 4 to act as a low pass filter and show its operation. Where would you put the speaker? Repeat 4a-g using the new designed circuit.
(6.) Construct the following circuit and test the speaker with headsets. Connect the amplifier output directly to the headphone jack (without the potentiometer). Load is the headphone jack in the schematic. “Speculate” the operation of the circuit with a video.
 Video 4: Microphone to Auxiliary Jack circuit operation explained
*It should be noted that the headphones did work, but the pin-out for the auxiliary jack can differ for certain brands of headphones, trying different combinations based on the rings in which connect to the circuit can save you a lot of time, and frustration.
 |
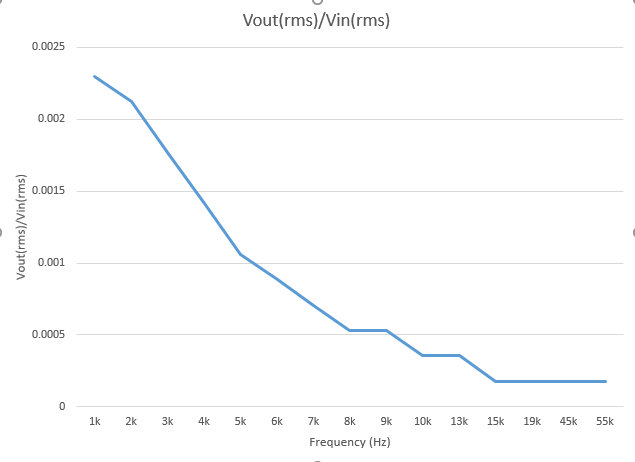
| Plot 1: Vout/Vin vs. Frequency graphed by Excel |
(d.) What is the cut off frequency by looking at the table (b.) and plot of it in (c.)?
- Based off the data in plot 1 from Table 3, the cutoff frequency is about 2900 Hz because it appears to change its Vout/Vin path more rapidly.
(e.) Draw Vout/Vin with respect to frequency using MATLAB, use the following code:
Frequency = [ ]; % data points will be in the brackets
Output = [ ]; % Vout/Vin data points would be in the brackets.
plot(Frequency, Output, ’o-r’)
xlabel(' '); %Right your x-axis label in ‘’
ylabel(' '); %Right your y-axis label in ‘’
title(' '); %Title of your plot |
| Plot 2: Vout/Vin vs. Frequency plotted using MATLAB High Pass Filter |
(f.) Calculate the cut off frequency theoretically and compare with one that was found in c.
- Taking fc = Vmax * (1/√2) so [0.002142857 * 0.707107 = 0.001515] which according to table 3 the Vout/Vin matches up with frequency's within the 2400 - 2900 Hz range.
(g.) Explain how the circuit works as a high pass filter.
- Notice that the voltage increases more around the frequency of about 3000 Hz. Additionally it can be said that the voltage's cutoff point is just below 10000 Hz. This shows how a high pass filter works, by not allowing lower frequency's to pass until it reaches the 3 kHz range.
(5.) Design the circuit in 4 to act as a low pass filter and show its operation. Where would you put the speaker? Repeat 4a-g using the new designed circuit.
(a.) Explain the operation. (video)
Video 3: Low pass filter operation explained
(b.) Fill out the following table by adding enough (10-15 data points) frequency measurements. Vout is measured with the DMM, thus it will be rms value.
(b.) Fill out the following table by adding enough (10-15 data points) frequency measurements. Vout is measured with the DMM, thus it will be rms value.
 |
| Table 4: Data recorded for Low Pass filter |
(c.) Draw Vout/Vin with respect to frequency using Excel.
(d.) What is the cut off frequency by looking at the table (b.) and plot of it in (c.)?
(e.) Draw Vout/Vin with respect to frequency using MATLAB.
(f.) Calculate the cut off frequency theoretically and compare with one that was found in c.
(g.) Explain how the circuit works as a low pass filter.
 |
| Plot 3: Vout/Vin vs. Frequency graphed by excel |
(d.) What is the cut off frequency by looking at the table (b.) and plot of it in (c.)?
- According to table 4 and the plot 3, the cut-off frequency is around 3-5 kHz.
(e.) Draw Vout/Vin with respect to frequency using MATLAB.
 |
| Plot 4: Vout/Vin vs. Frequency plotted using MATLAB
Low Pass Filter
|
- fc = Vmax * (1/√2) so [0.002298038 * 0.707107 = 0.001625] which according to table 4 the Vout/Vin matches up with frequency's 3-4 kHz.
(g.) Explain how the circuit works as a low pass filter.
- The circuit works as a low pass filter by only allowing lower frequencies to pass, as you begin increasing the frequency the voltages begin to cut off (trend lower).
(6.) Construct the following circuit and test the speaker with headsets. Connect the amplifier output directly to the headphone jack (without the potentiometer). Load is the headphone jack in the schematic. “Speculate” the operation of the circuit with a video.

*It should be noted that the headphones did work, but the pin-out for the auxiliary jack can differ for certain brands of headphones, trying different combinations based on the rings in which connect to the circuit can save you a lot of time, and frustration.
Did you have any complications during the lab? We had a few issues on a couple of the setups, but other than that we didn't to many problems. We got a little different values comparing our blogs, but they are all around the same values, just not to identical. Blog looks good!
ReplyDeleteYes, many times throughout the lab we felt unsure whether or not our data was recorded correctly or not. When comparing to last years blogs it was a chaotic mess, everyones data was different. Thankfully, other blogs for this year eventually uploaded similar data to ours so we did not have to redo any of our tables. Some things such as the range of the data could be changed to help expand the "more important" parts of our plots.
Deletei think we get the same values for question #1 which is 8 ohm and i think this the right the value that all the groups get in this question.
ReplyDeleteWe had much difficulty finding the value for the speaker online, even on the manufacturers website it was difficult. We ended up assuming that the resistance stayed the same as it did for last years 393 blogs.
DeleteWe had almost the exact same value for #1. Overall it looks like you did a good job on the lab but the graphs are a little off to me. It looks like the data points that were taken were inconsistent which is why the graphs are squiggly and not straight or a constant curve. Did you guys possibly have trouble reading the values or what, because I think that is where we made mistakes too because our graphs aren't completely perfect either. But overall you guys did a great job on the lab! I liked the videos that were posted good explanation explaining them too.
ReplyDeleteWe took 10-15 data points, we were attempting to show a better representation of the cutoff frequency's but shouldn't have used such a large data range after (Knowing now that we did not need to show anything past 20+ kHz). Thank you appreciate the feedback!
DeleteYou guys used a much larger range of frequency points than we did and therefore came up with a pretty different curve than we did. Is there any particular reason you decided to uses sucha large range?
ReplyDelete